
I’ve been following the inexorable path of this pandemic since the very beginning, primarily through Worldometer’s website located here. In early 2020, I was paying really close attention as the casualties mounted. I was recording the figures into a spreadsheet and plotting a graph of how deaths and infections were growing.
Sometime toward the end of the Summer I gave up; I had other things to do and the pandemic seemed to be waning. That was just before the Fall and Winter spike really ran up the numbers. Even then I didn’t return to recording and plotting. I decided to leave that to others as I was merely replicating what several organizations were already doing, and my desire to be able to pore over the data wasn’t enough to justify the time it would have taken.
On December 29, 2020 I tested positive for Covid-19 and spent the next ten days both quarantined in my bedroom and miserable with the virus. I came close to going to the hospital but, thankfully, it didn’t happen and I recovered. I am now fully vaccinated (Team Moderna) and have fully recovered, with the exception of a couple of “long-haul” symptoms: occasional fatigue; loss of smell (it returns intermittently); some brain fog … which is maddening but seems to be subsiding with time.
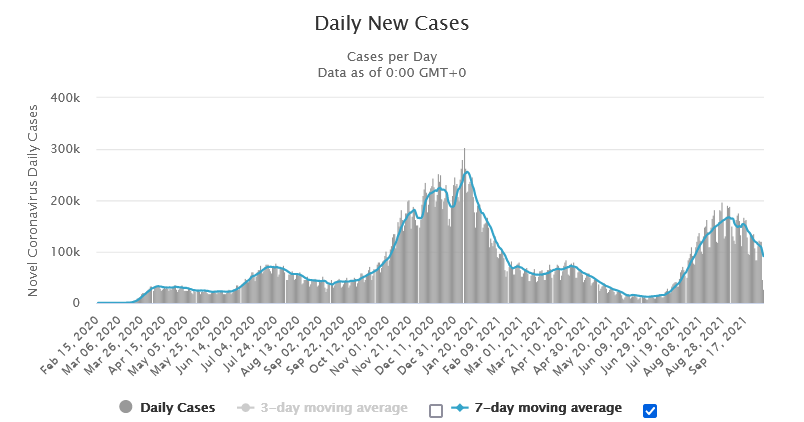
Through this time, I’ve continued to monitor the ebb and flow of this virus and its movement through the country. One thing that’s always struck me as odd is how the numbers really go down on the weekends. I’m pretty sure this is more an artifact of reporting, e.g. how many admin staff are home for the weekend, etc., but if you look at the graph (above) you can see a consistent drop in reported cases and deaths each and every weekend.
It’s almost as if the Grim Reaper doesn’t exactly take the day off, but certainly puts the brakes on every Saturday and Sunday. Maybe people are so accustomed to relaxing on the weekend that even the gravely ill manage to hang on through those days just out of habit. I know that being calm and taking care of business played a significant role in my recover. I was “lucky” in that I have dealt with lung issues most of my life, so I was closely attuned to what was happening to me and was able to relax and allow my body’s natural defenses to take over.
As the above graph clearly shows, we’re on the way down again, but I’m somewhat apprehensive that we’re going to see another spike as the weather cools down and people start spending more time indoors. I hope I’m wrong, but history seems to want to tell a different story than we’d all prefer was the case.


